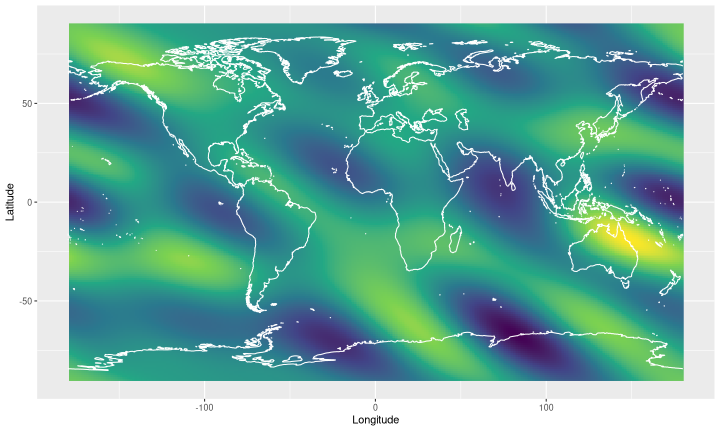
# this code simulates some random data on a 2d lat/lon
# grid and puts them into a data frame
set.seed(456)
mat  = matrix(0, 360, 181)
mat[1:5, 1:5] = rnorm(25) + 1i * rnorm(25)
mat = Re(fft(mat, inverse=TRUE))
dat = crossing(Latitude = -90:90,
               Longitude = -179:180) %>%
  mutate(data = c(mat))

# load coast lines from Rnaturalearth package and
# convert to tidy data frame
coast = ne_coastline(scale = 'medium') %>% fortify

# plot data and overlay add coastline
ggplot(dat) +
  geom_raster(aes(x=Longitude, y=Latitude, fill=data),
              show.legend=FALSE) +
  geom_path(data=coast, aes(x=long, y=lat, group=group),
            colour='white') +
  scale_fill_viridis_c()
