Stefan Siegert

Schotter in ggplot

This piece is inspired by the 1960 computer graphic Schotter. The image is a simple square tiling that transitions from ordered to disorderd. It seemed straightforward to create something similar in R, with a few random numbers and some ggplot magic. And I'm really quite happy with the outcome.

library(tidyverse)
crossing(x=0:10, y=0:10) %>%
  mutate(dx = rnorm(n(), 0, (y/30)^1.5),
         dy = rnorm(n(), 0, (y/30)^1.5)) %>%
  ggplot() +
    geom_tile(aes(x=x+dx, y=y+dy),
              fill='darkorange3', colour='black',
              lwd=2, width=1, height=1, alpha=.7,
              show.legend=FALSE) +
    scale_y_reverse() +
    theme_void()
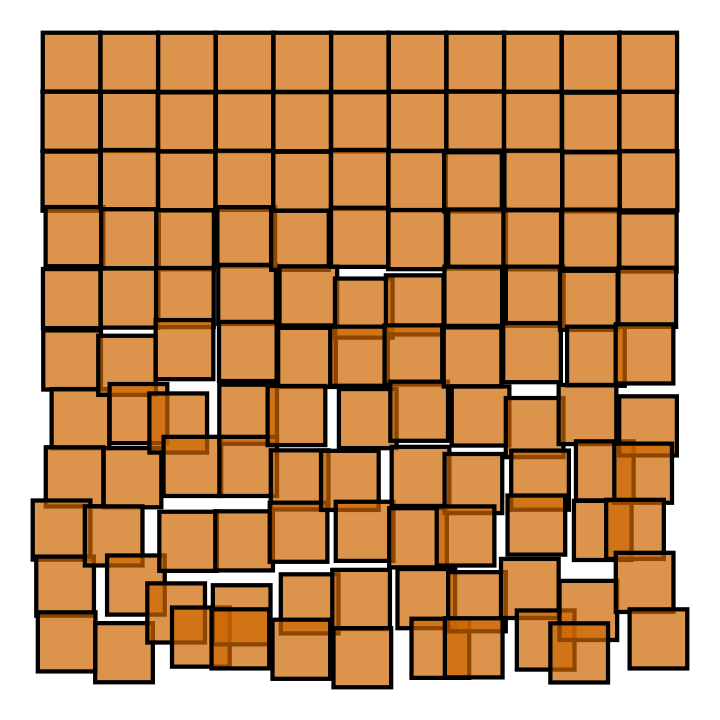
plot of chunk schotter1

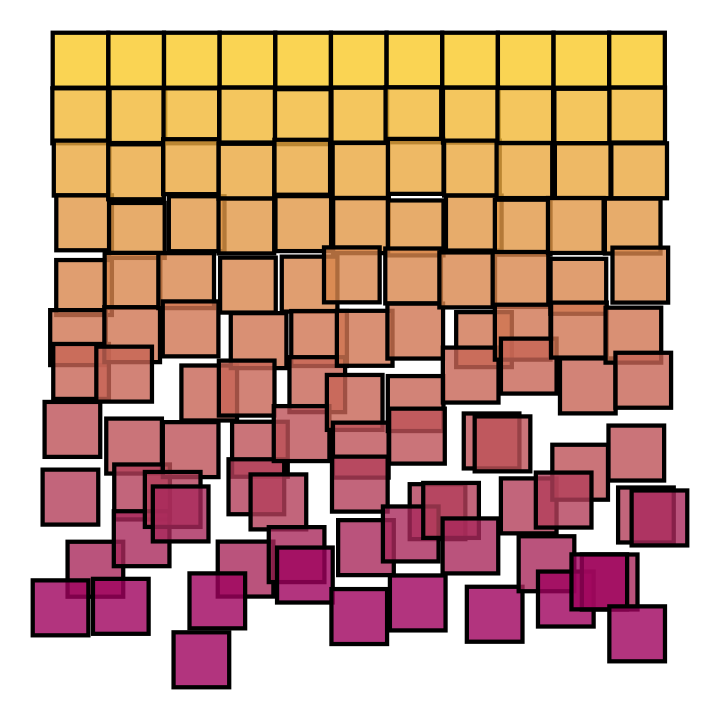
Here is another one with a nice color gradient:

crossing(x=0:10, y=0:10) %>%
  mutate(dx = rnorm(n(), 0, (y/20)^1.5),
         dy = rnorm(n(), 0, (y/20)^1.5)) %>%
  ggplot() +
    geom_tile(aes(x=x+dx, y=y+dy, fill=y), colour='black',
              lwd=2, width=1, height=1, alpha=0.8,
              show.legend=FALSE) +
    scale_fill_gradient(high='#9f025e', low='#f9c929') +
    scale_y_reverse() +
    theme_void()
plot of chunk schotter2

It isn't straightforward to add rotation to any of the tile/rect/raster geometries in ggplot, as in the original image. To include rotation I would probably use geom_polygon, but the data generation and plotting code would become much more complicated. But honestly I really like the images without the rotation effect, so that's ok.

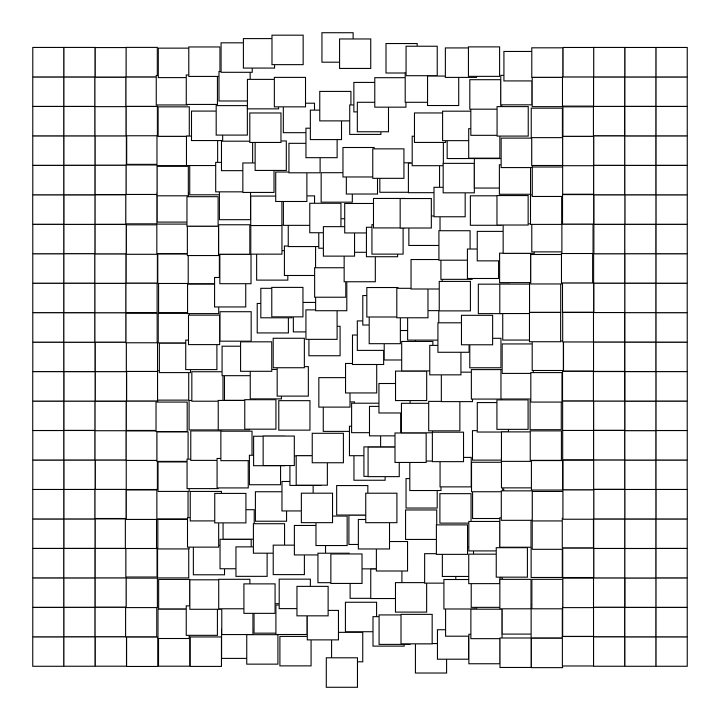
Some more variations:

crossing(x=0:20, y=0:20) %>%
  mutate(sd = .3*exp(-(x-10)^2/16),
         dx = rnorm(n(), 0, sd),
         dy = rnorm(n(), 0, sd)) %>%
  ggplot() +
    geom_tile(aes(x=x+dx, y=y+dy), fill='white', colour='black',
              lwd=.5, width=1, height=1) +
    theme_void() +
    theme(aspect=1)
plot of chunk schotter3