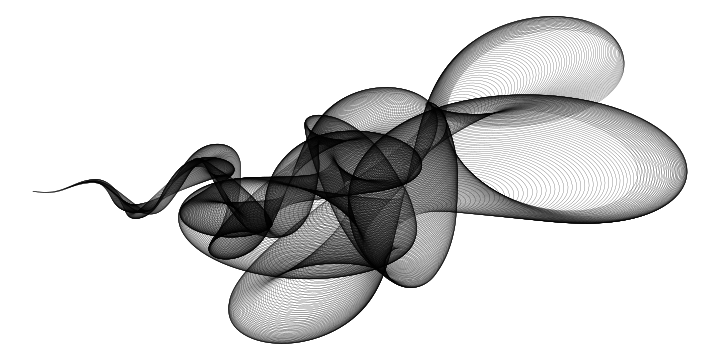
n = 1000
set.seed(3)
tibble(
  i = 1:n,
  ran1 = c(arima.sim(list(ar=c(1.999, -0.9995)), n, sd=1e-3)),
  ran2 = c(arima.sim(list(ar=c(1.999, -0.9995)), n, sd=1e-3))) %>%
mutate(theta = list(seq(0, 2*pi, len=200))) %>%
unnest(cols=c(theta)) %>%
rowwise() %>%
mutate(dr = ran1 * cos(theta) + ran2 * cos(2*theta) +
            ran2 * sin(theta) + ran1 * sin(2*theta),
       r = .01 * (1 + i/n)^2 + (i/n)^2 * dr,
       x = r * cos(theta) + 10 * i/n,
       y = r * sin(theta) + ran1 * i/n) %>%
ggplot() +
  geom_path(aes(x=x, y=y, group=i), lwd=.1) +
  theme_void()
