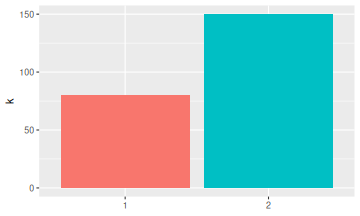
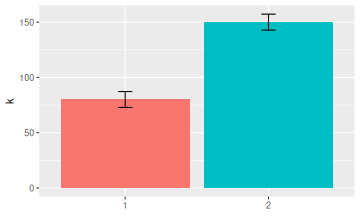
Doesn't it bother you when people don't put error bars on their histograms? They're the worst! Here is a quick and dirty way to approximate missing error bars on histogram bars. That is, we go from this
Normally, we would use the standard error formula for Binomial proportions: Let \(k\) be the count and let \(n\) be the total sample size. Then the proportion corresponding to \(k\) is \(p = k/n\) and the standard error associated with \(k\) is \[\sigma = \sqrt{n p(1-p)}\]
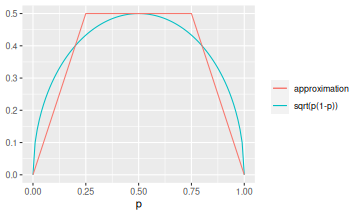
The approximation I like to use is \[\sqrt{p(1-p)} \approx \min\left(\frac12, 1 - |2p - 1|\right)\]
which looks like this
The approximation seems quite complicated, but can be calculated quickly using the fold-double-cap-multiply-by-root-n algorithm:
For example, in the first histogram, we have \(k \approx 80\) and \(n \approx 240\). For a quick approximation, let's say \(\sqrt{n} \approx 15\). Doubling \(p=1/3\) gives \(2/3\), which is bigger than \(1/2\) so we cap it to \(1/2\). Multiplying by \(15\) gives an estimate of the standard error of \(7.5\). The exact value in this example would have been \(7.22\). Pretty good.
Another useful heuristic comes from noticing that \(\sqrt{p(1-p)}\) is never bigger than \(1/2\). So the maximum width of any Binomial proportion error bar is \(\sqrt{n}/2\). This allows us to get a quick upper bound, which is enough if we're only interested in whether the difference in bar heights is significant.