library(tidyverse) library(Matrix)
Assume we have data on a 2d grid, but some values are missing, something like this:
# ground truth x = rbind( c(10, 11, 12, 13, 14), c(12, 13, 14, 15, 16), c(14, 15, 16, 17, 18), c(16, 17, 18, 19, 20), c(18, 19, 20, 21, 22), c(20, 21, 22, 23, 24)) # observation, with data missing y = rbind( c(10, NA, NA, 13, 14), c(12, NA, NA, 15, NA), c(14, NA, NA, 17, 18), c(16, 17, 18, 19, 20), c(18, 19, 20, NA, NA), c(NA, 21, 22, 23, NA))
Then we model the observed data as truth plus independent noise. \[Y_{i,j} = X_{i,j} + \eta_{i,j}\] where \(\eta_{i,j}\) is iid zero-mean Normal with precision \(\kappa\). We'll also assume that \(\kappa\) much greater than \(\tau\), that is, the observation error is much smaller than the internal variability of the RW2D.
It can be shown that the vectorised version of \(X\) (obtained by stacking the columns of the matrix into one long vector) is a multivariate Normal random vector defined by \[e = (1_m \otimes D_n + D_m \otimes 1_m) x\] where \(e\) is a vector of iid Normals with mean zero and precision \(\tau\), \(1_m\) and \(1_n\) are identity matrices of dimension \(n\) and \(m\), and \(D_n\) and \(D_m\) are tridiagonal \(n\times n\) and \(m \times m\) matrices of the form \[\frac14 \left(\begin{matrix} 1 & -1 & &\\ -1 & 2 & -1 &\\ & \ddots & \ddots & \ddots\\ & & -1 & 2 & -1\\ & & & -1 & 1\\ \end{matrix}\right)\] Hence \(x\) is multivariate Normal with mean zero and precision matrix \[Q_x = \tau R_x = \tau (1_m \otimes D_n + D_m \otimes 1_m)^T (1_m \otimes D_n + D_m \otimes 1_m)\]
The matrix \(R_x\) is often called the structure matrix of the precision matrix.
The observed data \(y\), given the vector of true values \(x\) is then given by \[y = Ax + \eta\] where \(\eta\) is a vector of iid Normals with zero mean and precision \(\kappa \gg \tau\) and the matrix \(A\) is the incidence matrix that extracts a subset of values from the \(x\) vector. For example, if \(x\) has length 4 and only the first and the third elements of \(x\) are observed in \(y\), the matrix \(A\) is equal to \[\left(\begin{matrix}1 & 0 & 0 & 0\\0&0&1&0\end{matrix}\right)\]
So now we have a Bayesian hierarchical model with the latent level \[x \sim N(0,Q_x^{-1})\] and data level \[y|x \sim N(Ax, Q_y^{-1})\] where \(Q_y\) is a diagonal matrix.
A bit of matrix algebra shows that the conditional distribution of \(x\) given \(y\) is also multivariate Normal with expectation \[ E[x|y] = (\theta R_x + A^T A)^{-1} A^T y\] where \(\theta = \tau / \kappa\) is the ratio of precisions. Since we assumed that \(\kappa\) is large compared to \(\tau\), we set \(\theta = 10^{-6}\) or a similarly small value.
Below is an R implementation of the method:
nx = ncol(y) ny = nrow(y) y_vec = c(y) Dx = 0.25 * bandSparse(n=nx, k=0:1, sym=TRUE, diag=list(rep(c(1,2,1), c(1, nx-2, 1)), rep(-1, nx-1))) Dy = 0.25 * bandSparse(n=ny, k=0:1, sym=TRUE, diag=list(rep(c(1,2,1), c(1, ny-2, 1)), rep(-1, ny-1))) Ix = Diagonal(nx) Iy = Diagonal(ny) DD = kronecker(Ix, Dy) + kronecker(Dx, Iy) RR = crossprod(DD) theta = 1e-6 # calculate incidence matrix A colsA = which(!is.na(y_vec)) rowsA = seq_along(colsA) valsA = rep(1, length(colsA)) dimA = c(length(rowsA), length(y_vec)) AA = sparseMatrix(i=rowsA, j=colsA, x=valsA, dims=dimA) AtA = crossprod(AA) # now `AA %*% x` returns the vector of non-missing values # calculate conditional expectation of missing values x_vec_inferred = solve(theta * RR + AtA, AtA %*% y_vec) # retain original x values and replace missing values # by their conditional expectation y_vec_imputed = y_vec i_na = which(is.na(y_vec)) y_vec_imputed[ i_na ] = x_vec_inferred[ i_na ] # convert back into ny-nx matrix y_imputed = matrix(y_vec_imputed, ny, nx)
## true values
## [,1] [,2] [,3] [,4] [,5] ## [1,] 10 11 12 13 14 ## [2,] 12 13 14 15 16 ## [3,] 14 15 16 17 18 ## [4,] 16 17 18 19 20 ## [5,] 18 19 20 21 22 ## [6,] 20 21 22 23 24
## observed values
## [,1] [,2] [,3] [,4] [,5] ## [1,] 10 NA NA 13 14 ## [2,] 12 NA NA 15 NA ## [3,] 14 NA NA 17 18 ## [4,] 16 17 18 19 20 ## [5,] 18 19 20 NA NA ## [6,] NA 21 22 23 NA
## imputed values
## [,1] [,2] [,3] [,4] [,5] ## [1,] 10.00 11.01 12.11 13.00 14.00 ## [2,] 12.00 12.69 13.79 15.00 15.77 ## [3,] 14.00 14.79 15.86 17.00 18.00 ## [4,] 16.00 17.00 18.00 19.00 20.00 ## [5,] 18.00 19.00 20.00 21.19 21.94 ## [6,] 19.83 21.00 22.00 23.00 23.38
# plot results crossing(jj=1:nx, ii=1:ny) %>% mutate(`A: true` = c(x), `B: observed` = c(y), `C: imputed` = c(y_imputed)) %>% pivot_longer(-c(jj,ii), names_to='type', values_to='value') %>% ggplot() + geom_raster(aes(x=jj, y=ii, fill=value)) + facet_wrap(~type) + scale_y_reverse() + labs(x=NULL, y=NULL)
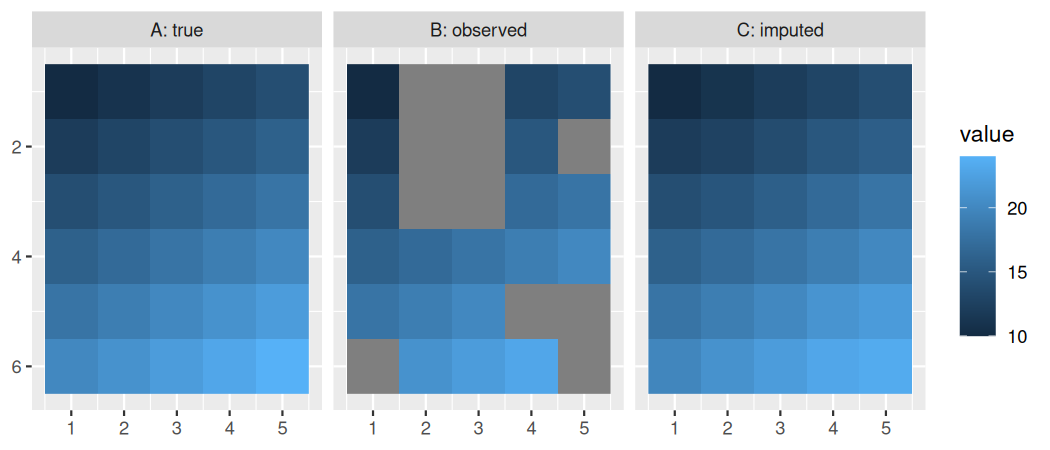
We might look at the imputation error to see how well it worked:
# mean squared imputation error imp_err = mean((x[i_na] - y_imputed[i_na])^2) # total variance of (non-missing) data tot_var = var(c(y), na.rm=TRUE) # imputation error vs total variance ratio imp_err / tot_var
## [1] 0.005397514
So the error variance is about 0.5% of the total variance, which I think should be acceptable in most use cases.
More advanced imputation models can include latent processes on multiple scales, and different degrees of spatial correlation in different parts of the domain. For small domains like the one used here, the simple model works well, and not much would be gained by fancier techniques. Of course the performance of the method depends on the data.
The parameter \(\theta\) could be treated as a tunable parameter. But again, the imputation error is so small here that a sensitivity analysis doesn't make much sense.